Evaluation of the American Wind Industry

Evaluation of the American Wind Industry

Evaluation of the American Wind Industry

By Liam Sullivan

Wind Energy is a growing industry in the United States. In 2012, wind energy accounted for 42% of all new capacity and represented $25 billion in new investment (5). Although it has recently received more attention through the advent of fracking, natural gas accounted for a smaller percentage of new capacity than wind energy in 2012 at 31.5%. Wind energy already accounts for a significant sector of US energy production. The US currently has 61,110 Megawatts of installed wind project capacity and comprises 5.7% of total U.S. installed electric generating capacity (2). This paper will show that American wind energy firms will continue this trend of growth which will make the wind industry very competitive in the American energy industry. There are five reasons for this. First, unlike other forms of energy, wind energy creates an incredibly low amount of negative externalities. Conversion to wind energy would actually save the US precious water resources because of the nature of its energy creation process and would slow down the process of global warming that has been facilitated by other forms of energy through the emission of greenhouse gases. For the negative externalities that wind energy does create, most, such as noise pollution and the use of land by windmills, can be addressed through community dialogue and the creation of proper zoning laws. They do not need excessive environmental regulations such as the ones that are needed to prevent an oil or gas leak. Second, wind energy is more financially feasible than other forms of energy except for natural gas. Also, wind energy prices are less volatile which make it an attractive alternative for investors. Third, wind energy manufacturers exercise market power through product differentiation. This enables wind energy manufacturers to receive high profits which give them the ability to develop more efficient wind energy technologies. Fourth, a trend in the American wind energy industry indicates that some companies may merge with others due to economies of scale making them more efficient. Lastly, the Production Tax Credit has had a significant positive impact on the conduct of wind energy firms in the US and will continue to do so in the future due to its strong political support.

Wind Energy Firms Produce Fewer Negative Externalities Than Other Energy Producing Firms Making Them More Attractive to Consumers
The costs of negative externalities due to wind energy are very low. It produces no air or water pollution (3). With those efficiencies, wind energy can help address two major problems in the US: climate change and the growing shortage of fresh water. Wind energy does not produce harmful emissions like natural gas which will help slow down the process of global warming that unclean forms of energy have facilitated. It is estimated that by 2030, U.S. wind power will save nearly 30 trillion bottles of water (2). If wind energy continues to expand, and the demand for water in the US remains the same, this should shift the supply curve of water outward thereby decreasing the price of water in the US. This will help combat the issue of water shortages that have deeply affected dry regions in the US. In comparison, an average multi-stage hydraulic fracking job with current technology today uses somewhere between 2 and 5 million gallons of water which creates an opportunity cost when this water is used for fracking (6). This water could be used instead for public consumption which helps hydrate US citizens.
Nonetheless, wind energy does create some negative externalities. Wind turbines are made of large amounts of steel and other materials, such as composites, ductile iron, concrete, aluminum, copper and adhesives (4). These resources have to be extracted from the earth and the processes in which they are extracted and formed can harm the environment. According to estimates, wind turbine life-cycle global warming emissions are between 0.02 and 0.04 pounds of carbon dioxide equivalent per kilowatt-hour (7). Meanwhile, life-cycle global warming emissions for natural gas generated electricity are between 0.6 and 2 pounds of carbon dioxide equivalent per kilowatt-hour and estimates for coal-generated electricity are 1.4 and 3.6 pounds of carbon dioxide equivalent per kilowatt-hour. Therefore, although wind energy does produce global warming emissions, it produces significantly less than other forms of energy.
The National Wind Coordinating Committee (NWCC) has found that windmills negatively impact certain species of birds and bats. Peer-reviewed research found evidence of bird and bat deaths from collisions with wind turbines and due to changes in air pressure caused by the spinning turbines, as well as from habitat disruption. Despite their impact, the NWCC concluded that these impacts are relatively low and do not pose a threat to species populations (7). While wind turbines may harm birds and bats, studies suggest that off-shore wind mills may increase fish populations by acting as artificial reefs (7).
Windmills take up land which creates an opportunity cost since the land can be used for other productive purposes. The National Renewable Energy Laboratory of large wind facilities in the United States found that they use between 30 and 141 acres per megawatt of power output capacity (7). But land at wind facilities can be used simultaneously for other productive purposes including livestock grazing, agriculture, highways, and hiking trails. This minimizes the opportunity cost of wind facility land use.
Windmills also raise the issue of incompatible land use. Windmills create noise which is caused by the rotation of the blades or the windmill itself. Overall, sound levels depend on wind speed and turbine design. So far, government-sponsored studies in Canada and Australia have found that these issues do not adversely impact public health (7). There are recorded complaints of noise pollution from windmills so proper zoning laws should be implemented to ensure that residents are not negatively impacted by the development of a windmill. Windmill aesthetics create a similar issue. To some people, they are graceful sculptures; to others, they are eyesores that compromise the natural landscape. Community dialogue can be initiated to determine whether or not a windmill should be developed.
There is concern that windmills negatively impact real estate prices. The evidence that addresses this concern is mixed. A study that collected data from more than 50,000 home sales among 27 counties in nine states found that no statistical evidence that home values near turbines were affected in the post-construction or post-announcement/pre-construction periods (8). Meanwhile, a study of 11,331 property transactions over nine years in northern New York State found that nearby wind facilities significantly reduce property values in two of the three counties studied (9). Therefore, although on a national scale windmills do not significantly affect real estate prices in the US, there is still the possibility that they can and the issue should be addressed in the process of development of a windmill. In the case that a windmill does negatively impact the price of nearby real estate, owners of the real estate should somehow be compensated for their loss so that that the socially efficient amount of wind energy can be provided to American communities.

Financial Feasibility Makes Wind Energy Attractive to Consumers
Wind energy technology has progressed to the point where it makes financial sense for Americans to convert to its use. According to the Energy Information Administration, in 2013, land based wind energy is the third most affordable option for new electricity generation. The next most affordable options in successive order are conventional natural gas and advanced natural gas (4). The levelized cost of electricity is a good measure to use to compare the competiveness of different energy providers. It represents the per-megawatt hour cost (in real dollars) of building and operating a generating plant over an assumed financial life and duty cycle. Key inputs to calculating the levelized cost of electricity include capital costs, fuel costs, fixed and variable operations and maintenance costs, financing costs, and an assumed utilization rate for each plant type. For wind energy plants entering service in 2019, the levelized cost of electricity is 64.1 dollars per Megawatt hour in 2012 dollars while for all the different types of natural gas plants the average cost is 25.56 dollars per Megawatt hour (10). But natural gas does not have as much of a competitive edge over wind energy as it may seem. The average levelized price difference is much narrower when you look at land based wind energy and compare it to natural gas. The levelized price of off-shore wind energy raises the average levelized price of wind energy (4). The average levelized price of wind based energy for new land based windmills in 2011/2012 was around $40 which made these particular wind mills more competitive with natural gas providers (4).
Another one of the advantages that wind energy has over natural gas is price volatility. Windmills have minimal maintenance costs and they do not require fuel to operate which makes the price of wind energy production predictable (11). Today’s wind turbines have sophisticated electronic controls that allow continual adjustment of their output which help maintain price volatility. They can help grid operators stabilize the grid in response to unexpected operating conditions, like a power line or power plant outage (7).

Market Power Through Product Differentiation
The low price of natural gas is actually a cause of concern for economists. Industry experts fear that the prices are too low to be sustained because they do not provide an adequate income stream to producers (11). This means that natural gas producers are operating very close to making normal profits. If any crisis happens to any of the producers it will be hard for the natural gas producer to make up for the losses. In comparison, wind energy producers don’t face the same large risks such as gas leaks. In addition, windmill manufacturers benefit from product differentiation. There are different types of windmills for different types of wind environments and different types of windmills for the same environment. For example, Aris Wind is focused on producing a small-scale wind turbine which is suitable in low wind environments and therefore appropriate for generating power for schools, commercial buildings, and street lights (1). In contrast, GE produces very large wind turbines which are suitable for powering large-scale factories and homes (18). There is a market for each of the different types of windmills. They have patents for their technology which ensures that windmill manufacturers make large profits from the sale of their differentiated windmill. The rents that these manufacturers obtain from these sales allow the companies to create new windmill technologies which helps make windmills more efficient and thus more attractive to consumers of energy.

Possibility of Merging Between Wind Energy Companies due to Economies of Scale
Unlike other sources of energy such as natural gas, wind energy has no fuel cost and a much lower marginal operating cost than other resources that have fuel costs (17). This means that it costs wind energy firms much less and makes them more efficient to produce additional power than other energy firms such as coal and natural gas companies which face higher costs as they extract more fuel from the environment. This makes the wind energy industry an economy of scale. This trait has made wind energy firms competitive with other energy companies. But this is also causing wind energy firms to become competitive with each other. There is a high incentive for wind energy firms to engage in big wind turbine development projects such as the construction of wind farms because of their increasing returns to scale. To do so requires large amounts of capital and investment. The more efficient a firm is at accomplishing large scale wind turbine development projects, the more contracts and investment it will win over other firms. As of now, there are a high number of competitors in the global wind energy manufacturing market place and a high degree of merging activity is yet to be seen there. But wind energy firms tend to dominate by region with GE dominating most of the market in the US in 2012 as shown in the graph below (20). If there is any merging, it is likely that each region will be dominated by a different wind energy firm due to the specialization costs of operating in a specific region. Such merging would most likely be beneficial for the US.

Of the 6,816 megawatts of wind capacity installed in the U.S. in 2011, GE led with 29.4 percent (2,006 megawatts from 1,252 turbines). Vestas was close behind, with almost 29 percent (1,969 megawatts from 952 turbines). Siemens was again third, with just over 18 percent (1,233 megawatts, 534 turbines) (20). This shows that wind energy firms outside the US are competing with GE at an increasing rate. GE will have to step up production in order to prevent other firms from taking up its dominant position or else they will cut into GE’s wind energy revenues putting GE at risk of being acquired by another firm. Interestingly, in 2012, the average size of all turbines installed in the U.S. took its biggest jump since 2008, moving from 1.77 megawatts to 1.97 megawatts (20). This is another indication that the clients of wind energy firms are looking for large scale wind turbine projects which need large amounts of capital and investment. Such a change in tastes indicate that the wind industry is starting to become an economy of scale which may require merging.

The Production Tax Credit
The Production Tax Credit was begun with the Energy Policy Act of 1992. The Production Tax Credit (PTC) reduces the federal income taxes of qualified tax-paying owners of renewable energy projects based on the electrical output (measured in kilowatt-hours, or kWh) of grid-connected renewable energy facilities for the first ten years of commercial operation (12). This enables wind developers to sell wind electricity at a lower price to power purchasers. There are two requirements to qualify for the PTC. A tax-paying entity must own the generating asset and sell the electricity to an unrelated third party. Entities that do not pay taxes, such as publicly owned electric utilities, rural electric cooperatives and government bodies, may not take advantage of the PTC. Investor-owned utilities do qualify for the PTC. Firms can qualify for the PTC as long as the US Federal Government approves it to take effect. The US Federal Government usually approves it to take effect in one or two year intervals (13). The graph on the next page shows that in the past, the expiration of the PTC in certain years has caused annual wind capacity installation to dramatically decrease while the extension of the tax credit has caused it to increase (14).

The PTC certainly seems to have helped pick up the rate of annual wind capacity installation since 1997. But while wind energy firms have clearly benefited from the PTC, they are severely limited by the time constraints of the tax-credit. The planning and permitting process for new wind facilities can take up to two years or longer to complete. As a result, many renewable energy developers that depend on the PTC to improve a facility’s cost effectiveness may hesitate to start a new project due to the uncertainty that the credit will still be available to them when the project is completed (14). Therefore, if the duration of effect of the PTC were longer, the rate of annual wind capacity installation would be much higher. The lack of available information on the tax credits, prevents the wind energy sector from reaching its full economic potential because although a wind turbine construction may be feasible in the present, firms may decide to wait and hold off on constructing the project so that they can receive the potential benefits of the tax-credit. This creates an opportunity cost in the form of the wind energy that could have been produced earlier in time.
Although the previous graph indicates a dramatic decrease in annual installed wind capacity in 2013 due to the PTC expiration at the end of 2012, the PTC was extended at the last minute on January 2, 2013. This delayed the construction and investment in wind energy in 2013. By the end of 2013, there were a record 12,000 MW and 100 projects under construction (15). As a result the annual installed wind capacity that will be reported for 2014 will be much higher than it was in 2013. In fact, it will be the second largest increase ever in US annual installed wind capacity. It is likely that annual installed wind capacity rates will remain high in the near future since a change (and a year extension) to the PTC on December 31, 2013 included an adjustment of eligibility criteria that is expected to result in the qualification of projects that began construction in 2013 and maintain construction into 2014 and 2015; under current IRS guidance, projects that maintain construction into 2016 might also qualify (15). These extensions will allow more wind energy firms to offer wind energy at a competitive price to energy consumers in the near future.
Furthermore, it is likely that there will be continued support for the PTC because of a report released by the Department of Energy in 2008. The report examined a scenario where the U.S. reaches 20% wind electricity by 2030, concluding it is technically and economically feasible (16). This should provide strong encouragement for legislatures to continue to allow the PTC to be effective. Also, there is widespread political support for implementing energy independence legislation ever since the energy crises of the 1970s due to the peaking of oil production in major industrial nations (Germany, United States, Canada, etc.) and embargoes from other producers and the 1990 oil price shock which resulted from the Gulf War. To support the notion for widespread political support, The Gotham Research Group poll found 73 percent of registered voters support continuing the Production Tax Credit (PTC), including 63 percent of registered Republicans, 74 percent of Independents, and over 71 percent overall in all regions of the country (19). Therefore, politicians have a strong motivation to continue the effectiveness of the PTC for wind energy.

Conclusion
One of the most distinguishing features of wind energy is its capacity to minimize negative externalities which other forms of energy tend to create. Dirtier forms of energy create negative externalities which often go unaccounted for by the US government. Wind energy provides reassurance that such negative externalities are minimized. Even where negative externalities are created, they can easily be solved through community dialogue or zoning laws. The large supply of natural gas has made natural gas very cheap in comparison to wind energy. On the other hand, wind energy is more reliable which makes it attractive for consumers of energy to use to guarantee that they receive energy at a constant price. Furthermore, the structure of the wind energy market enables firms to receive higher profits than firms in the natural gas market which ensures that wind mill manufactures can make investments in wind mill technologies which continue to make wind energy more affordable. Due to the fact that the wind industry has traits that can identify it as an economy of scale, it is likely that wind energy firms will merge in the future which will have an efficient outcome due to the large amounts of investment and capital that need to be acquired to create a full functioning wind turbine project. The availability of the Production Tax Credit shows that the timing of wind turbine construction projects play an important part in their profit making ability for firms. American Wind energy firms need more reliable information on the duration of these tax credits so the growth of the wind energy sector can be steady and sustained.

Bibliography
1. Aris Wind. Aris Wind Sustainable Energy Solutions. http://ariswind.com/
Web. 25 November 2014
2. Wind Energy Foundation. Interesting Wind Energy Facts. http://www.windenergyfoundation.org/interesting-wind-energy-facts
Web. 25 November 2014.
3. National Geographic. Wind Power. http://environment.nationalgeographic.com/environment/global-warming/wind- power- profile/
Web. 25 November 2014.
4. American Wind Energy Association. Wind Energy Facts at a Glance. http://www.awea.org/Resources/Content.aspx?ItemNumber=5059
Web. 25 November 2014

5. American Wind Energy Association. 2012 US Wind Industry Market Update. http://awea.files.cms- plus.com/FileDownloads/pdfs/AWEA%20U.S.%20Wind%20Industr y%20Annual%20M arket%20Update%202012_1383058080720_3.pdf
Web. 25 November 2014
6. Blackmon, David. Forbes. Water For Fracking, In Context. http://www.forbes.com/sites/davidblackmon/2013/07/01/water-for-fracking-in- context/. Web. 25 November 25, 2014
7. Environmental Impacts of Wind Power. (n.d.). Retrieved November 25, 2014, from http://www.ucsusa.org/clean_energy/our-energy-choices/renewable- energy/environmental-impacts-wind-power.html#.VHTxs8np-Sp 8. http://emp.lbl.gov/publications/spatial-hedonic-analysis-effects-wind-energy- facilities-surrounding-property-values-uni
9. Heintzelman, M., & Tuttle, C. (2011). Values in the Wind: A Hedonic Analysis of Wind Power Facilities. Retrieved November 25, 2014, from http://iiccusa.org/wp- content/uploads/2011/03/Values-in-the-Wind.pdf10. http://www.eia.gov/forecasts/aeo/electricity_generation.cfm
11. Economics | Wind Energy Foundation. (n.d.). Retrieved November 25, 2014, from http://www.windenergyfoundation.org/about-wind-energy/economics
12. Goodward, Jenna, and Mariana Gonzalez. “Bottom Line on Renewable Energy Tax Credits.” Bottom Line on Renewable Energy Tax Credits. 1 Oct. 2010. Web. 14 Dec. 2014. <http://www.wri.org/publication/bottom-line-renewable-energy-tax-credits&gt;.
13. “Federal Production Tax Credit for Wind Energy.” Federal Production Tax Credit for Wind Energy. Web. 14 Dec. 2014. <http://www.awea.org/Advocacy/content.aspx?ItemNumber=797&gt;.
14. “Production Tax Credit for Renewable Energy.” Union of Concerned Scientists. Web. 14 Dec. 2014. <http://www.ucsusa.org/clean_energy/smart-energy-solutions/increase-renewables/production-tax-credit-for.html#.VI3uPmMkR8E&gt;.
15. “Momentum Builds to Restore Wind Energy Tax Credit.” Environment News Service RSS. 14 Apr. 2014. Web. 14 Dec. 2014. <http://ens-newswire.com/2014/04/14/momentum-builds-to-restore-wind-energy-tax-credit/&gt;.
16. “US Wind Industry: Market Update.” American Wind Energy Association, 1 May 2011. Web. 14 Dec. 2014. <http://www.awea.org/files/FileDownloads/pdfs/U-S-Wind-Industry-Market-Update-Factsheet-May-2011.pdf&gt;.
17. “Data Show Wind Energy Reduces Energy Bills through Market Competition, Contradicting Exelon’s Claims.” Data Show Wind Energy Reduces Energy Bills through Market Competition, Contradicting Exelon’s Claims. 27 Mar. 2014. Web. 15 Dec. 2014. <http://www.awea.org/MediaCenter/pressrelease.aspx?ItemNumber=6265&gt;.
18. “Wind Turbines – Wind Power | GE Energy.” GE Energy. Web. 15 Dec. 2014. <http://www.ge-energy.com/products_and_services/products/wind_turbines/index.jsp&gt;.
19. Theele, Shauna. “New Poll Finds 73 Percent of Voters Support Crucial Tax Policy for Wind – Blog – Into the Wind.” New Poll Finds 73 Percent of Voters Support Crucial Tax Policy for Wind – Blog – Into the Wind. 25 Nov. 2014. Web. 15 Dec. 2014. <http://aweablog.org/blog/post/new-poll-finds-73-percent-of-voters-support-crucial-tax-policy-for-wind&gt;.
20. Trabish, Herman. “GE Still Dominates US Wind Manufacturing but New Faces Are Emerging.” 1 May 2012. Web. 15 Dec. 2014. <http://www.greentechmedia.com/articles/read/ge-still-dominates-u.s.-wind-making-but-new-faces-are-emerging&gt;.

The Great Contributions of John Maynard Keynes to Classical Economics

The Great Contributions of John Maynard Keynes to Classical Economics

The Great Contributions of John Maynard Keynes to Classical Economics

By Liam Sullivan
Due to his contributions to classical economics, John Maynard Keynes is revered as one of the fathers of modern macroeconomic theory and widely considered to be one of the three most important economists of all time, along with Adam Smith and Karl Marx. To this day, economic and policy leaders incorporate Keynes’ ideas, referred to as Keynesian economics, into their policy own policy decisions. Before the introduction of Keynes’ ideas in the mid 1930’s, most economists believed that markets operated best on their own as pure capitalist systems. Keynes challenged this consensus with the publication of his paper General Theory of Employment, Interest, and Money in 1936. In it he argued that government interventionist policy was necessary in order to combat excessive boom and bust cycles in a nation’s economy. Keynes’ ideas began to gain favor during the Great Depression. Many of his proposals influenced American and British governments, particularly Roosevelt’s New Deal policies. In this paper, Keynes theorizes several principles. First, savings and investment are determined independently of each other. Second, a nation’s income is the aggregate of its consumption and investment. Keynes writes about how problems associated with these theories can be remedied by the government. Keynes’ contributions to classical economic theory influenced how it was applied to the real world. For instance, Keynes played a central role in the establishment of a world central bank and an international currency regulation body. It would later take form as the World Bank and the International Monetary Fund. Keynesian economics experienced a resurgence near the onset of the financial crisis in 2008 when the US, Europe, and China facilitated the passage of stimulus packages and heavy government spending. Keynes’ contributions to classical economics are very significant and they live on to this day.
The first theory that Keynes states in his paper, General Theory of Employment, Interest, and Money, states that savings and investment are determined independently of each other. He elaborates that savings rates are determined by a society’s propensity to consume and investment by an expected rate of return relative to interest rates (Briggs). These two relationships are illustrated in the graphs below:


The first graph which shows the relationship between consumption and disposable income shows that as disposable income increases, consumption increases. So the relationship is direct. The line which shows the relationship is called the consumption schedule. The value of the slope of the line is known as the Marginal Propensity to Consume (MPC). If you subtract this value from 1 you obtain the Marginal Propensity to Save value. The MPC and MPS values show how much a person or country consumes or saves with each unit increase or decrease in income. The relationship shows that before this country makes $2000 billion, the country is consuming more than it is making in order to meet its needs. At the $2000 billion mark, the country’s consumption equals its income. After the $2000 mark, the country begins to save more than it consumes since it has met all of its needs. The distance between the 45 degree line and the consumption schedule represents the country’s savings. The second graph demonstrates the relationship between the expected interest rate and the amount of investment. The relationship shows that as interest rates decrease, the amount of investment made increases. People or countries (depending on the context of the situation that the graph demonstrates) have to make a larger investment if they want to make their desired return with the low interest rate. These graphs demonstrate very well the different factors which determine savings and investment in an economy. This helps explain why Keynes asserts that measures have to be taken by the government to stimulate both during a recession since they are independent of each other.
Keynes’ second theory states that a nation’s income is the aggregate of its consumption and investment. During a downturn, this could potentially create a never-ending spiral as businesses invest less, jobs are lost, consumers spend less, businesses have even less reason to invest, and so on. Therefore, in a period of unemployment and decreased production, these two problems are best resolved by increasing the amount spent on investment and consumption (Briggs). According to Keynes, this is where the government has the responsibility to step in to prevent the situation from becoming worse. To help the situation, the government has to engage in deficit spending which is spending that reduces or offsets a surplus. Hopefully the government actually has a surplus so they do not have to borrow from elsewhere. This would lead to policies such as the reduction of long-term interest rates, public works projects, and infrastructure spending. The implication that deficits could be a good thing for the economy was quite revolutionary at the time (Briggs).

aggregateexpenditures

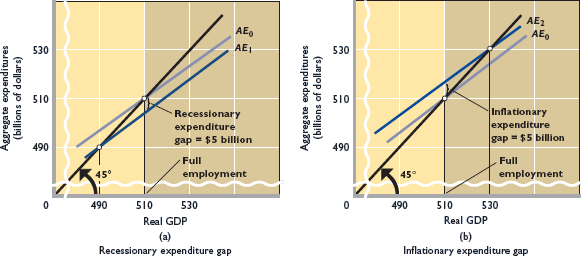
Keynes makes the point in his work that the economy performs its best when aggregate expenditures (consumption, investment, government expenditures and net exports if you consider open economies) are at the equilibrium point of full employment. The above graph on the left demonstrates a recessionary expenditure gap valued at $5 billion. With more people hired in production, that recessionary gap could be closed resulting in a healthier economy. This graph modeled the situation during the Great Depression. Keynes’ analysis of the situation influenced the development of Roosevelt’s New Deal programs which increased government spending in order to employ people, purchase goods, and stimulate more investment and consumption. Keynes also suggests another strategy to close a recessionary gap: lower taxes. This will encourage firms and people to make more investments and consume more. The graph on the right demonstrates an inflationary expenditure gap. The economy is at full employment in this equilibrium but they are producing at an unsustainable rate. Meaning workers are probably working overtime. Thus this gap will often close itself as workers experience fatigue.
The establishment of a world central bank and an international currency regulation body demonstrates the applications of Keynes’ contributions to classical economics. The World Bank is an international financial institution that provides loans to developing countries for capital programs. Developing countries are often plagued by poverty and unemployment. The World Bank helps address this problem by providing affordable loans (loans with low interest rates) to those impoverished countries. These affordable loans allow the developing countries to take on large infrastructure projects which employ the country’s workforce and help make the country’s economy more efficient. These methods are similar to President Roosevelt’s New Deal programs which reflect Keynes’ theory that if you increase aggregate spending you can help pull an economy out of a recession or depression. The International Monetary Fund is quite similar to the World Bank. It works to foster global growth and economic stability by providing policy, advice and financing to members, by working with developing nations to help them achieve macroeconomic stability and reduce poverty. Its three main functions are the following: oversee the fixed exchange rate arrangements between countries, thus helping national governments manage their exchange rates and allowing these governments to prioritize economic growth, and to provide short-term capital to aid balance of payments. Essentially, the IMF helps ensure that trade and financial processes are carried out fairly by countries. The application of Keynesian economics would not be possible if loans that the World Bank made did not accurately translate into the monetary systems of the receiving country nor would financing between two different countries translate accurately without the IMF. The IMF played a key role in mending the world economy after the Great Depression and World War II.
Keynes’ contributions to classical economics are also demonstrated by the 2008 financial crisis. The conditions that brought about the 2008 financial crisis were due in large part to the massive increase in unemployment. Employment sank by more than 8 million people, and the unemployment rate jumped above 10 percent. As recessions go, this was a big one! In 2008, the government applied Keynesian economic measures. They provided $100 billion of tax rebate checks to taxpayers, hoping that recipients would use most of their checks to buy goods and services. (They didn’t! Instead, they used substantial portions of their checks to pay off credit cards and reduce other debt.) In 2009, the federal government enacted a $787 billion stimulus package designed to boost aggregate expenditures, reduce the recessionary expenditure gap, and, through the multiplier effect, increase real GDP and employment (McConnell, 254). This is a very concrete example of the application of Keynesian economic measures.
Keynes’ methods of evaluating economic performance are now essential tools for economists. Without them, economists would not be able to determine how large an aggregate recessionary or expenditure gap is. They may not think to calculate consumption and investment separately. These methods are all essential tools in creating sound economic policy. Without them, the economic health of the US and many other nations would be put in danger. Furthermore, he made great contributions to the formation of the World Bank and the IMF, institutions which survive to this day and which helped piece the economic world together after the Great Depression and World War II. To say the least, economist John Maynard Keynes made several great contributions to classical economics and his work influences many, many lives.
Bibliography
Briggs, Brad. “John Maynard Keynes: The Man Who Transformed the Economic World.” John Maynard Keynes: The Man Who Transformed the Economic World. Investing Answers, 21 Jan. 2010. Web. 05 Mar. 2016.
McConnell, Campbell R., Stanley L. Brue, and Sean Masaki. Flynn. Macroeconomics: Principles, Problems, and Policies. Boston: McGraw-Hill Irwin, 2009. Print.

Fiscal Policy and the Great Recession: Did the Federal Government Get it Right?

Fiscal Policy and the Great Recession: Did the Federal Government Get it Right?

Fiscal Policy and the Great Recession: Did the Federal Government Get it Right?

By Liam Sullivan

The 2008 Recession, also known as the Great Recession, was one of the worst financial crises in the United States’ history. It is generally considered the largest downturn in economic activity since the Great Depression. It is officially determined to have lasted from December 2007 to June 2009. The economic slump began when the U.S. housing market went from boom to bust and large amounts of mortgage-backed securities and derivatives lost significant value. It is reported that the gap between actual and potential GDP during the recession was $2.6 trillion, unemployment peaked at 10.1 percent in October 2009, $7 trillion in the real estate industry was lost, the stock market decline brought another $11 trillion in losses, and retirement accounts lost $3.4 trillion. Meanwhile, human suffering was widespread: the Census Bureau estimated in 2010 that 46.2 million people were in poverty (Childress). In sum, the Great Recession was devastating for the United States’ economy and its people. And one of the most interesting aspects of the Great Recession is the fiscal policy the US government implemented before the Great Recession. Fiscal policy is the means by which a government adjusts its spending levels and tax rates to monitor and influence a nation’s economy. It is the sister strategy to monetary policy through which a central bank influences a nation’s money supply. Analysis of fiscal policy before the Great Recession reveals that government spending was relatively stable before the Great Recession (during which period it greatly increased). Meanwhile, income tax marginal rates were on a steady decline before the Great Recession and were just leveling out. The tax rate on some of the tax brackets actually increased during the Great Recession. The nature of fiscal policy before the Great Recession shows that the federal government was indeed using expansionary policy tools in order to combat the recession. On the other hand, their manipulation of the tax rate was a bit contrary to expansionary fiscal policy.
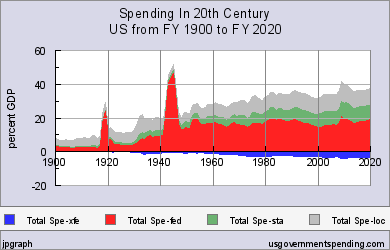
The first component of government fiscal policy is government spending. The government can effectively influence a country’s GDP by increasing or decreasing its spending. By increasing spending, the government can stimulate the economy thus increasing GDP or decrease government spending thus decreasing GDP. Below is a graph from the “US Government Spending” website which demonstrates the influence of government spending on GDP.

govspending

The graph shows that government spending has been a significant portion of GDP since the early 1900s. Government spending had really pronounced effects in the early 1920s and early 1940s which were due to the government expenses of World War I and World War II. In World War II, government expenses accounted for more than 40% of GDP! Up to about 2008/2020, government spending remained relatively stable. On the federal level, government expenditures accounted for between 15 and 20% of GDP between the 1950s and early 2000. But compared to pre-World War II levels, the amount of government spending accounted for much more of GDP than it did before and it seems to be following an upward trend.
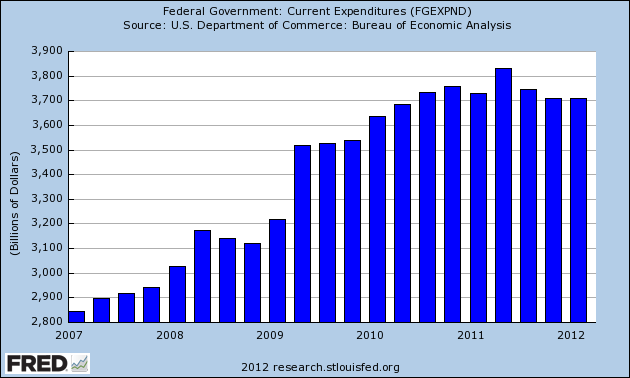
Upon closer examination of this graph, one can see that government spending jumped a good bit around 2010 which is when the US used quantitative easing to help the economy combat the recession. The graph below shows exactly how much the federal government was spending around this time (Bonddad Blog).

govcurrentexpend

The graph shows that between 2009 and 2011, government spending increased about $600 billion per year! More specifically, the federal government was making very cheap loans to banks in order to encourage lending in the economy. They also made expenditures in order to bail out failing companies like GM. The government has poured about $23 trillion into a host of programs and bailouts (Childress).
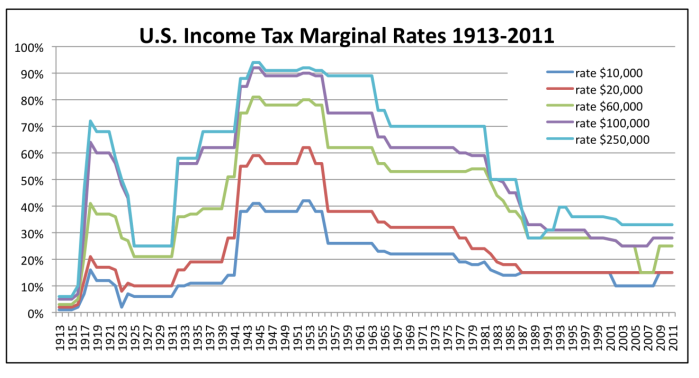
Manipulating the income tax rate is the second component of fiscal policy. By increasing taxes, the government can decrease GDP; firms and people have less money available to spend which decreases GDP. In contrast, by lowering the tax rate firms and people have more money to spend which increases GDP. Below is a graph which shows the historical income tax marginal rates (Jacobs).

ustaxrates

For the most part the tax system is progressive (the tax rate is higher for higher marginal tax rates).
The graph shows that income tax rates were on a long decline from their peak around the early 1940s. In the 1940s the government raised taxes incredibly high so that they could fund the war effort. The graph shows that just before the Great recession, income tax rates had almost flattened out. In fact they were very close to being at their all-time low. Interestingly, some of the marginal tax rates increase around the year 2008.
The US federal government clearly engaged in expansionary fiscal policy in regards to government expenditures during the Great recession. We are able to see this because of the relatively stable rate of government expenditures before the Great Recession. A big jump in the graph can be seen in the spot where the Great Recession occurs. Meanwhile, the income tax rate has remained relatively the same and does not indicate any drastic change before the Great Recession. In fact the income tax rate went up a little bit for some of the income brackets. This indicates contractionary fiscal policy. So what were the results of the Federal Government’s fiscal policy? The graph below demonstrates:

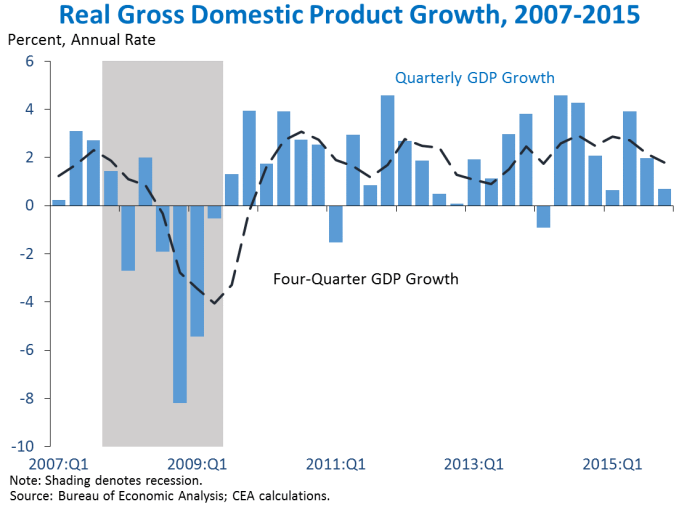
usgrowthrates

As the graph shows, the effects of the federal government’s fiscal policy were quite positive and immediate. The graph shows that in the third quarter of 2009, the US finally experienced positive GDP growth. The positive trend has mostly continued since then. What is really unique about this increase in GDP is that it coincides well with the large increase in federal government expenditures beginning in the second quarter of 2009. It only took one quarter for the federal government’s stimulus to make a positive effect on GDP. In the years after that, there were only two quarters of negative GDP growth. Therefore the slightly increased tax rate did not really have any contractionary effect on GDP growth. Overall, the federal government appears to have made positive contributions to the nation’s economy in the short term. It is yet to be seen if their policy has created structural problems in the nation’s economy. For instance, will the bailed out automotive company, GM, continue to thrive? Will the nation’s largest banks continue to make successful loans? These are nerve racking considerations since the federal government essentially “broke the rules” of free market capitalism. The Obama administration and federal government officials determined the costs would be too great if these industries were not bailed out. The Great Recession has caused the US to face an identity crisis and for now it can rest.
Bibliography
“The Bonddad Blog.” : So. N.p., 29 May 2012. Web. 02 May 2016. <http://bonddad.blogspot.com/2012/05/so-who-is-really-spending-more.html&gt;.
Childress, Sarah. “How Much Did the Financial Crisis Cost.” Frontline. PBS, 31 May 2012. Web. 02 May 2016. <http://www.pbs.org/wgbh/frontline/article/how-much-did-the-financial-crisis-cost/&gt;.
Jacobs, Tawn. “Tax Rates Yesterday, Today and Tomorrow | Savant Capital Blog.” Savant Capital Blog. N.p., 08 Aug. 2011. Web. 02 May 2016. <https://www.savantcapital.com/blog/tax-rates-yesterday-today-and-tomorrow/&gt;.
“US Government 20th Century Spending History with Charts – a http://Www.usgovernmentspending.com Briefing.” US Government 20th Century Spending History with Charts – a http://Www.usgovernmentspending.com Briefing. N.p., n.d. Web. 02 May 2016. <http://www.usgovernmentspending.com/past_spending&gt;.

Chances of Villanova Winning the NCAA BBall Tournament: 6.9%!

nova

The Villanova Wildcats beat the odds and won the NCAA Basketball Tournament. Thanks to Team Rankings for the calculation of their exact odds: https://www.teamrankings.com/ncaa-basketball/team/villanova-wildcats/bracketology. It’s there first NCAA title since ’85.

In comparison, it was calculated that UNC had a 13.3% chance of winning the NCAA tournament: https://www.teamrankings.com/ncaa-basketball/team/north-carolina-tar-heels/bracketology


Evaluation of Obama’s Proposal to Make Community College Education Free and Available to All American Citizens

In his last State of the Union Address President Obama thumped the floor of the House of Representatives’ congressional chamber and vocalized his intentions concerning community college education, “By the end of this decade, two in three job openings will require some higher education — two in three. And yet, we still live in a country where too many bright, striving Americans are priced out of the education they need. It’s not fair to them, and it’s sure not smart for our future. That’s why I’m sending this Congress a bold new plan to lower the cost of community college — to zero.” Free community college education is an appealing government provided service to anyone who desires an education or who is funding another’s education. In fact current economic research shows that Obama’s proposal is a favorable and realistic one which should be implemented in the future to increase US economic growth. The problems that Obama brings up in his State of the Union Address are indeed a reality. A significant portion of Americans will not qualify for jobs after 2020, the US labor force has become less competitive in international labor markets, and student loan debts have become a significant problem for recent and upcoming graduates. Therefore, Obama’s intention to address these problems is well placed. Although not fully complete, Obama’s proposal (America’s College Promise) so far is detailed and implementable. And there are three main reasons why the program will encourage the creation of an efficient market. First, America’s community colleges perform well at educating and employing graduates which make them a good investment for the entire country. Second, America’s College Promise requires candidates to pass a means test and requires students to maintain a certain GPA to become eligible for tuition and fee reimbursements. This creates incentives for upcoming college graduates to obtain the highest levels of education they are capable of achieving given their financial resources and abilities. It does not distort students’ incentives to obtain lower levels of higher education. Third, America’s College Promise is suitable for accommodating the needs of students who typically attend community colleges which include non-traditional students (those who are older than normal college aged students or attend college part-time).
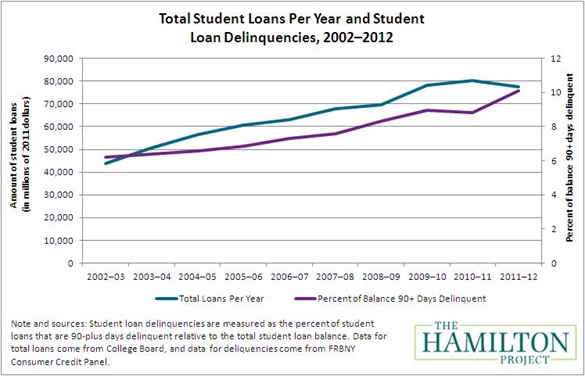
In his State of the Union address, Obama identifies three main problems which necessitate free community college education: the increased need for a college degree to obtain a job, increased competition for jobs due to the growth of highly skilled labor in foreign countries, and the burden of student loan debt. Current economic research shows that these problems are indeed a reality and need to be addressed in some form by the federal government since they are national problems. For the year 2014, only 41.89% of people of age 25 and over had attained an associate or bachelor’s degree or more. If that rate does not change, a significant portion of Americans will not qualify for jobs available in the American economy after the year 2020 (Obama projects that two-thirds of jobs will require a college degree by then). America has indeed lost jobs due to more competitive international labor forces. Manufacturing employment collapsed from a high of 19.5 million workers in June 1979 to 11.5 workers in December 2009 with many of these jobs being outsourced to foreign countries. Data from the U.S. Department of Commerce showed that “U.S. multinational corporations, the big brand-name companies that employ a fifth of all American workers… cut their work forces in the U.S. by 2.9 million during the 2000s while increasing employment overseas by 2.4 million (Lach; Center for American Progress). According to economic theory, the loss of these jobs should have caused the US economy to lose strength. Demand for goods and services would have failed to reach its full potential since there were fewer wage earners in the market than there could have been. Graphically, this situation would be reflected by a leftward shift in the demand curve resulting in a lower equilibrium price and quantity (assuming the supply curve remained constant and the workers failed to find work elsewhere). By providing more education to the US labor force, the government can make US citizens more attractable to employees thus protecting the US from outsourcing. In regards to the issue of student loan debt, as the graph below shows, the number of student loans that has been made each year has been rising and the total of student loan delinquencies (measured by a percent of total student loans) has been rising significantly. By 2012, 10% of students had not been able to pay their loans which penalized them financially.

hamilton

This demonstrates that student loan debt is becoming an increasing problem in the US. The increase in student loan delinquencies may prevent potential students from investing in education to improve their skills for fear of defaulting on their loans. And those who are delinquent have to invest more of their time and resources into paying their loans instead of improving their quality of life and investing in their education to increase their skills. By increasing the affordability of higher education, the government can prevent students from falling into the debt trap which will help increase their well-being and help them contribute more to the economy.
The criteria for full fee and tuition reimbursement at community colleges are well detailed in Obama’s proposed budget documents. Students must attend community college at least half-time, maintain a 2.5 GPA while in college, and make steady progress toward completing their program. People of all ages are eligible. The program would eliminate tuition and fees for all eligible students for a maximum of 4 years. Here’s one of the main catches of Obama’s proposal: students with adjusted gross income of $200,000 and above would not be eligible (Weissmann). This is contrary to Obama’s introduction of his proposal in his State of the Union Address, community college education will not be “reduced to zero” for everyone. It appears that Obama introduced his proposal this way to gain political support for his proposal from upper class voters. As a result, wealthier US citizens will not benefit directly from the program.
The nature of funding in Obama’s America’s College Promise is almost fully outlined. 25% of the program will be funded by state governments and 75% will be funded by the federal government (Sheehy; “Obama’s Free Community College Plan: What Students Need to Know”). It is not clear if the funding will be done through taxes, bonds, or debt finance.
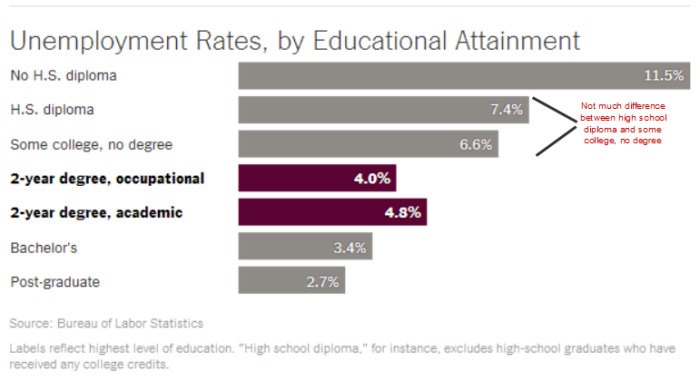
Overall, the criteria for eligibility in Obama’s proposal will help increase market efficiency. By requiring students to maintain a 2.5 GPA, the program ensures that receivers of community college aid are meeting educational requirements. In addition, Obama points out that his administration has been working to connect community colleges with local employers to train workers to fill high-paying jobs like coding, and nursing, and robotics. Indeed, economic research shows that community colleges do quite well at training graduates for and obtaining graduates for high paying jobs. As of the year 2014, careers in fields such as health care, manufacturing and information technology offer median earnings of up to $55,000 or more for graduates with an associate degree (Sheehy; 4 Degrees that are Better to Earn at a Community College). The unemployment rates for community college graduates are also relatively low even compared to students who graduate from four year colleges as the April 2014 unemployment data shows below (Leonhardt).

unemployment
This ensures that the students who receive community college aid and the US economy will make a return on investment for their degree afterwards for the students themselves and for the taxes and consumption they generate with their future earned wages. This will fuel future economic growth in the US.
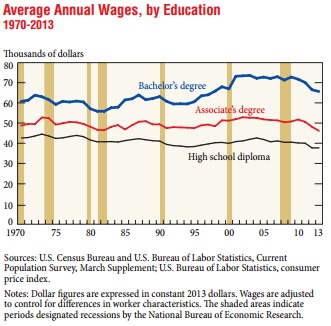
The means test helps create an efficient market because it ensures that those who are at a higher risk of defaulting on loans will be protected as opposed to students who are not at risk and do not need student financial aid at all. This helps increase the amount of funds available for those who are at most risk. The means test also incentivizes wealthier students to pursue levels of education which are higher than a community college education. The Federal Reserve completed a study of full-time workers ages 16-64 from 1970 to 2013 who had no more than a high school diploma, associate’s degree or bachelor’s degree. The study found that those with a bachelor’s degree generally earned 56% more than high school graduates and those with an associate’s degree 21% more than high school graduates (Marklein). The graph below show how the degree earners differ in wages.

wages

Clearly, investing in a bachelor’s degree is much better than investing in an associate’s degree. This profit incentive should encourage those students who can afford it to obtain higher skills than those obtained at a community college which will result in higher wages for US citizens and thus stronger economic growth.
America’s College Promise is truly accommodative to non-traditional students who typically attend community college. The average age at a community college is 28. It is not 18 or 19. In addition, 60 percent of students at two-year colleges are enrolled part time, (Sheehy; “Obama’s Free Community College Plan: What Students Need to Know”). If America’s College Promise did not accept these candidates, then a significant number of people would not qualify for the aid and the program would probably not have as large of a positive impact as it would. More people would probably default on their loans especially if they strained to make payments while attending college part time and working a part time job.
The current political environment at the Capitol suggests that Obama’s legislation will encounter strong resistance from politicians who dislike high government spending. But the current economic climate in America suggests that this is the right time for America’s College Promise since the education system is currently failing to ensure a strong future economic environment with students burdened with a high amount debt, students being unprepared for future jobs and US citizens being outcompeted for jobs in the international labor market. America’s College Promise should be clarified and implemented as soon as possible.

By Liam Sullivan
Works Cited
Greenstone, Michael, and Adam Looney. “Rising Student Debt Burdens: Factors Behind the Phenomenon.” The Brookings Institution. Brookings, 5 July 2013. Web. 21 Apr. 2015.
Lach, Alex. “5 Facts About Overseas Outsourcing.” Labor and Work. Center for American Progress, 9 July 2012. Web. 21 Apr. 2015.
Obama, Barak. “Remarks by the President in State of the Union Address.” The White House. The White House, 20 Jan. 2015. Web. 21 Apr. 2015.
“United States Census Bureau.” Educational Attainment in the United States: 2014. US Census Bureau. Web. 21 Apr. 2015.
Weissmann, Jordan. “Obama’s Free Community College Plan Has a Catch: Wealthy Kids Wouldn’t Be Eligible.” Moneybox. Slate, 2 Feb. 2015. Web. 21 Apr. 2015.
Sheehy, Kelsey. “Obama’s Free Community College Plan: What Students Need to Know.” US News. U.S.News & World Report, 16 Jan. 2015. Web. 21 Apr. 2015.
Leonhardt, David. “The Jobless Rate for Community-College Graduates Is Also Low.” The New York Times. The New York Times, 28 May 2014. Web. 21 Apr. 2015.
Marklein, Mary. “College Degree Still worth the Investment, Data Suggest.” News. USA Today, 24 June 2014. Web. 21 Apr. 2015.
Peralta, Katherine. “Benefits of College Still Outweigh Costs, Fed Study Says.” US News. U.S.News & World Report, 24 June 2014. Web. 21 Apr. 2015.
Sheehy, Kelsey. “4 Degrees That Are Better to Earn at a Community College.” US News. U.S.News & World Report, 3 Dec. 2014. Web. 21 Apr. 2015.

Alternate Paths to Economic Development

The following is a summary of a presentation by an economic professors at Providence College, Dr. Sirohi. It makes some interesting points about how economists (and we, as educated citizens) should measure and evaluate economic growth.

Summary of Dr. Sirohi’s Presentation: Alternate Paths to Economic Development
A Comparative Analysis of Brazil and India in the Era of Neoliberalism

In the 1940s and 50s there was debate between economists over one of the most basic economic theories: that free markets make everybody better off. Opponents to this theory during this time period proposed that markets were engines of growth for developed countries like the United States and Western Europe, not poorer countries. In his lecture, Dr. Sirohi assesses the growth of India and Brazil to help provide evidence about which theory economists should lean towards an anti-market or pro-market approach in understanding how developing economies properly develop. But Sirohi uses an unconventional economic method to compare and contrast the growth of India and Brazil. Rather than using GDP alone to assess growth, Sirohi combines his assessment with the Human Development Index (HDI) of the two countries which is a composite statistic of life expectancy, education, and income. Sirohi bases the method of his assessment on a paper by the economist Sen who asserted that goods are merely a means to an end which is well-being. Sen argues that how much someone owns tells little about the quality of a person’s life. For example, a bike may be worthless to a person with a handicap while it can be invaluable to a person without one.
Sirohi asserts that the main source of distinction between the economies of Brazil and India can be identified in the way that the governments in Brazil and India approach their respective economies. Whereas Brazil’s government encouraged markets and intervened to ensure benefits of markets trickled down to all citizens (pro-market approach), India’s government primarily focused on helping big businesses grow at the expense of lower class citizens. Since 1980, India has sustained remarkable GDP growth with most GDP growth above 5% per year. Between 2000 and 2010 it averaged 7.2% in GDP growth despite the 2008 recession. Even with such high GDP growth, India’s HDI is currently ranked 135 while Brazil is currently ranked 79 out of all countries. And Brazil has achieved that high HDI ranking despite lower GDP growth (between 2000 and 2010, Brazil GDP grew on average at a rate of 3.7%). Sirohi asserts that Brazil’s higher HDI level can be attributed to the rise in social spending that began in 1985 after the end of military rule. One of the key programs which helped Brazil achieve this was its Bolsa Familia program which administers a variety of social welfare services to Brazilian citizens. One of its unique features is the conditional cash transfer scheme in which it only supplies welfare cash to poor people who meet certain conditions. For example some, families cannot receive cash unless they send their children to school or health clinics. Another remarkable feature of Brazil’s Bolsa Program is that it usually only costs .1% of GDP which is an incredibly small amount for such a large social welfare program.
Sirohi concludes that to understand true growth, economists must not only look at how much an economy is growing but also where the growth is happening. Sirohi asserts that sustained growth will occur when the growth is evenly dispersed amongst its population. He pointed out during his presentation that during military rule of Brazil between 1964 and 1985 growth was uneven and a large portion of workers were oppressed which resulted in the overthrow of the military regime. Fortunately for Brazil, the new government enacted policies which positively improved the lives of the average Brazilian. Sirohi suggests that the Indian government should adopt similar policies so that the lives of average citizens can improve.

By Liam Sullivan

What Exactly Explains the Circumstances of the Black Underclass?

The following is an evaluation of these two major sociological works The Truly Disadvantaged: The Inner City, the Underclass, and Public Policy and American Apartheid: Segregation and the Making of the Underclass. In this essay I evaluate each work’s position on the aforementioned topic of the black underclass. Feel free to comment as I know that this is quite a hot button issue. I very much appreciate any criticism.

The Truly Disadvantaged: The Inner City, the Underclass, and Public Policy is by William Julius Wilson who taught as a Sociology professor at the University of Chicago from 1972 to 1996 before moving to Harvard University. Wilson specializes in the study of race and the underclass in America and has written extensively on the effects of structural, economic, and cultural factors on African Americans. American Apartheid: Segregation and the Making of the Underclass is by Douglass S. Massey and Nancy A. Denton. Massey is currently a professor of Sociology at the Woodrow Wilson School of Public and International Affairs at Princeton University. He specializes in the sociology of immigration, and has written on the effect of residential segregation on the black underclass in the United States. Denton is currently the Director of the Lewis Mumford Center for Urban and Regional Research and was an Assistant Professor of Sociology at the time the book was published. She is best known for the work she contributed to American Apartheid and she focuses on studying immigration and segregation in New York. In both books, the authors address essentially the same research question: How was the black underclass in American inner cities created? Both books compile an extensive amount of quantitative studies and observations to conduct their analysis of the issue. Startlingly, the authors arrive at two very different conclusions. Wilson argues that the creation of the black underclass was not racially driven while Massey and Denton argue that it was. The authors’ respective fields of expertise help clarify the reasons for their conclusions. Wilson asserts that the main driving forces which explain the state of the black underclass are deindustrialization, the age structure of the American population (the Baby Boomer generation effect), and the out migration of middle class residents (Wilson; pg. 18). In contrast, Massey and Denton argue that the sole driving force is racial segregation with black ghettos being its characteristic institutional form (Massey & Denton; pg. 9).
In The Truly Disadvantaged, Wilson identifies four main problems exhibited by the black underclass: female headed households, unemployment, poverty, and crime. Wilson observes that although black ghetto neighborhoods had high rates of poverty, it was not until the mid-1970s that these problems reached catastrophic proportions (Wilson; pg. 3). To put these problems into perspective, in 1965 nearly 25% of all black families were headed by women, and by 1980 43% were; as a result, welfare dependency increased (Wilson; pg. 21). To put the issue of violence amongst blacks into perspective: only one of nine persons in the U.S. is black; yet in 1984 nearly one of every two persons arrested for murder and nonnegligent manslaughter was black, and 41% of all murder victims were black (Wilson; pg. 22). Wilson shows that poverty is an issue which more greatly affects blacks than whites. For instance, in 1978 15.9% of black families have incomes below $4,000 while it is only 4.3% for whites. These statistics also show that low incomes were correlated with female heads of households. In black families, 80.3% of those making below $4,000 were female headed while in white families 42.2% were female headed. In the two highest income brackets ($16,000 to 24,999 and $25,000 and over) white families have much higher proportions represented (Wilson; pg. 28). In terms of unemployment, between 1948 and 1984, the black unemployment rate steadily increased from 5.9% to 14.4% while it reached only 6.5% for whites (Wilson; pg. 31).
Wilson identifies three main processes which produced the social problems which the black underclass faces. These are the economic shift in the U.S. manufacturing industry, the out-migration of middle class black residents from the inner cities, and the growth in young minorities in central cities. In regards to the economic shift, Wilson explains that inner cities, where the large majority of black families lived and worked in manufacturing jobs, were beginning to change from goods producing centers into centers of administration, information exchange, and higher-order service provision. This is especially true for northern cities. For instance, in New York from 1970 to 1984, the number of jobs in industries which required less than a high school education decreased by 492,000 whereas those with higher education requisites increased by 239,000 (Wilson; pg. 41). Similar losses and gains occurred in other northern cities. Because black employment was not concentrated in the growth industries, the unemployment rate and labor-force dropout rates among working age central-city blacks increased. In comparison, cities in the south and west added more jobs which required lower educational achievement so these rates were not as high for blacks in these areas (Wilson; pg. 42). In despite of the low skilled job losses in the north, 2.1 million nonadministrative jobs in food and drink industry were added nationwide between 1975 and 1985 which exceeds the total number of production jobs available in the combined automobile, steel, and textile industries in the U.S. (Wilson; pg. 42). Wilson explains that the reason why the unemployed blacks did not occupy these jobs (which they qualified for in terms of education) was because these jobs were created primarily in the suburbs, exurbs, and non-metropolitan areas which were far from where they lived.
Wilson asserts that the out-migration of middle class blacks from inner cities contributed to the development of social problems in black ghettos. Wilson observes that between 1970 and 1980 in the five largest U.S. cities, which contained nearly half of the total poor population of the fifty largest cities, the poverty population increased 22% while the total population in these five largest cities decreased 9% (Wilson; pg. 46). In the extreme poverty areas, the total black population increased by 148% and it increased 164% in poor black areas. Because of the exodus of middle and working class blacks from these areas, Wilson explains that these areas lost an important “social buffer” which could have deflect the negative effects of increasing joblessness in inner city neighborhoods which occurred between the 1970s and early 1980s. Wilson elaborates that social institutions such as churches, schools, stores, and recreational facilities would have been maintained more effectively had they remained. The middle class and working class people would also have served as role models for the lower classes who would have shown them that pursuing education and employment is a worthwhile goal and family stability is a norm (Wilson; pg. 56).
Wilson asserts that the sudden growth of young black minorities in the inner cities of the United States contributed to the increasing rates of social dislocation, such as crime, in those areas. In 1977, the median age of blacks in central cities was 23.9 and the number of blacks aged fourteen to twenty-four rose by 78% from 1960 to 1970 (Wilson; pg. 36). Wilson points out that 66% of all those arrested for violent and property crimes in U.S. cities were under twenty-five years of age in 1980 and teenagers accounted for 38% of all out-of-wedlock births in 1982 (Wilson; pg. 37).
In American Apartheid, Massey and Denton identify four main problems exhibited by the black underclass. The first problem that they identify is the high level of black and white segregation which is exhibited by cities across America. Blacks are segregated into socially isolated and poor neighborhoods (ghettos) while whites live in wealthier ones. Massey and Denton explain that until the end of the nineteenth century blacks and whites were relatively integrated in both northern and southern cities. As late as 1900, the typical black urbanite still lived in a neighborhood that was predominantly white (Massey & Denton; pg. 10). By 1970, high levels of black-white segregation had become universal in American cities. To be precise, in 1970, the index for black-white segregation was 84.5% on average in northern cities and 75.3% in southern cities (Massey & Denton; pg. 64). To convey the experiences of blacks more accurately, Massey and Denton study a variable called black isolation which measures the likelihood that a black person will come in contact with a white person. In 1970, the average value of this measure is 68.7% in northern cities and 69.3% in southern cities (higher values indicate a black person is less likely to come in contact with a white person (Massey & Denton; pg. 64). By 1980, the average value of black-white segregation remained over 80% in northern cities and it only declined to 68.3% in southern cities. Meanwhile, the value of black isolation remained above 60% in both northern and southern cities. Interestingly, the Fair Housing Act was passed in 1963 which intended to stop the systematic placement of public housing in black neighborhoods and banned the discrimination in the rental and sale of housing. Evidently, this act did not stop the trends of segregation and isolation.
The second problem which is identified and which is connected to the problem of segregation is hypersegregation. Hypersegregation refers to the way a group of people are located or spread out over a specific geography or urban landscape. High degrees of unevenness, isolation, cluster, concentration, and centrality reflect hypersegregation. Within sixteen large metropolitan areas (containing one-third of the blacks in the U.S.) the extent of racial segregation was so intense that the pattern can be identified as hypersegregation.
The third problem that Massey and Denton identify is the continuance of white prejudice. Despite whites’ endorsement of the idea that people should be able to live wherever they can afford to regardless of race, a majority still feel uncomfortable in any neighborhood that contains more than a few black residents. This white prejudice fuels a pattern of neighborhood resegregation.
The fourth problem that Massey and Denton identify is the maintenance of poor black segregated ghettos. Massey and Denton’s analysis reveals that even as the socioeconomic status of black groups rises, the extent to which they are segregated does not decline. It would be expected that as a black person’s income increases, that person would move into neighborhoods with better home values, schools, and services. This trend is not seen in their analysis as blacks of all socioeconomic levels are highly segregated. Instead conditions of poverty are perpetuated in these segregated ghettos.
In American Apartheid, Massey and Denton explain that one of the social processes which created the segregated black ghetto involved a series of well-defined institutional practices, private behaviors, and public policies by which whites sought to contain growing urban black populations (Massey & Denton; pg. 10). Massey and Denton point out that a study by the U.S. Department of Housing and Urban Development reveals that Housing audits carried out between 1970 and 1990 show widespread discrimination against black renters and homebuyers. Evidence also suggests that blacks can expect significant discrimination in the allocation of home mortgages as well.
A second process which explains the existence of highly segregated black neighborhoods is the prevalence of white prejudice. According to the process, as the percentage of blacks rises in a neighborhood, the number of whites who say they would refuse to enter or would try to move out increases. Meanwhile, blacks tend to prefer racially diverse neighborhoods. So as the percentage of blacks in a neighborhood rises, white demand for homes in the area sharply decreases while black demand rises. This yields a process of racial turnover.
A third process which helps explain the continued existence of poor segregated black ghettos pertains to the susceptibility of ghettos to economic downturns. Since these ghettos are predominantly poor, in the event of an economic downturn, commercial institutions withdraw goods and services from the markets of the neighborhoods. As a result the neighborhood decays as property owners decide not to maintain and invest in the neighborhood which results in unemployment. This lowers the incentive for neighbors to maintain their properties. This reduces vigilance in the neighborhood which promotes crime and drug use. This process is very similar to broken windows theory.
A fourth process which helps explain the continued existence of poor segregated black ghettos is the creation of oppositional culture. As a result of the high degree of segregation, Black English has progressively become progressively more distant from Standard American English which puts its speakers at a severe disadvantage in schools and labor markets. The values developed in ghettos also go against the values of middle-class society (excelling in education, obtaining employment). Anthropologists have found that young people in the ghetto experience strong peer pressure not to succeed in school which severely limits their prospects for social mobility in the larger society. Massey and Denton compile quantitative research which shows that growing up in a ghetto neighborhood increases the likelihood of dropping out of high school, reduces the probability of attending college, lowers the likelihood of employment, reduces income earned as an adult, and increases the risk of teenage childbearing and unwed pregnancy. These trends keep segregated black ghettos impoverished.
One of the strong points of Wilson’s argument is his discovery of the correlation between arrest rates and age. Wilson observes that in the 1970s, there was a sudden increase in the number of young blacks in inner cities and soon after, arrest rates in the 1980s revealed higher proportions of young offenders. This observation helps put into perspective why the social conditions of black ghettos seemed so severe. Young people are more likely to behave violently and commit crime and as a result, black ghettos expressed high amounts of social disorganization.
The main problem with Wilson’s argument is that he does not provide a sufficient explanation about why blacks could not respond properly to the changing economic environment. Wilson observes that blacks are heavily concentrated in low skilled jobs which began to lose their availability between 1970 and 1980 especially in northern cities. Meanwhile, 2.1 million jobs were created in the food and drink industry throughout the U.S. According to Wilson, low skilled blacks could not move to where these jobs were created because they were too far from inner cities areas. More importantly they were located in the suburbs. If blacks are knowledgeable about these jobs, it is unlikely that they would not make a significant effort to migrate to the locations of these jobs to escape the severe poverty of the inner city black ghettos. In addition, if blacks took out loans or mortgages so that they could move to these places, it is likely that this debt should be approved since the jobs guarantee a reliable income for the black candidate and the lender. To say racism is not involved in this process is a severe understatement of the problems of discrimination against blacks which Massey and Denton reveal in their studies of mortgage lending practices and housing audits.
Another problem which Wilson overlooks is the link between incredibly high incarceration rates of blacks and female headed households. Wilson does observe that while incarceration rates for severe crimes like murder are similar for blacks and whites, black incarceration rates for less serious crimes such as theft are much higher during the 1970s (Wilson; pg. 32). But Wilson does not further this analysis. He does not provide statistics on the change in percentage of black incarceration rates for different types of crime and for the black population as a whole. Wilson asserts that the rise in female headed households is mainly caused by the lack of steadily employed black males, changing social values towards out-of-wedlock births, and the increased economic independence of women due to income transfer payments (Wilson; pg. 72). But Wilson does not incorporate an analysis of how high incarceration rates of black males affect the rate of female headed households. The high rates of incarceration rates amongst black males should have been attributable to the high rate of female headed households.
The greatest source of strength in Massey and Denton’s argument is their analysis of the housing market forces and residential transformations that occurred to create the conditions of the black underclass which Wilson is completely ignorant of. Massey and Denton observe that the increased savings during World War II was dispensed on capital after people began to desire spending that income with the onset of peace. People began having children at astronomical rates and as a result people desired to build homes in spacious suburbs. But suburban relators prevented blacks from obtaining such homes. For instance, a study of Chicago realtors in the 1950s reveals that 80% of realtors refused to sell black properties in white neighborhoods (Massey & Denton; pg. 50). Blacks were also discriminated against by the Home Owners’ Loan Corporation which made loans to prospective home buyers. Massey and Denton’s observation shows that across the nation, black neighborhoods were given low ratings which prevented these people from obtaining loans (Massey & Denton; pg. 51). To make matters worse, private banks often adopted the HOLC rating system which prompted further disinvestment in black neighborhoods. This analysis helps provide an explanation as to why blacks couldn’t move to the suburbs
One weakness in Denton and Massey’s argument is the generalizability of discrimination in the housing market against blacks to all American cities. Indeed, programs like the HOLC are national organizations which would have impacted the housing markets of the U.S. on a national level. But how severe were they affected in each city? For instance, how many black neighborhoods in America were redlined? Massey and Denton point out counties like Bronx County and King’s county in Brooklyn, New York. But Massey and Denton do not present any graph or chart which measures this in other U.S. counties. This makes it difficult to understand the exact effect redlining had on a national scale. Second, Massey and Denton cite that 80% of realtors in Chicago refused to sell property to blacks. What about realtors in other neighborhoods? Massey and Denton also point out that private banks often used the HOLC’s loan ratings of neighborhoods to make investment decisions (Massey & Denton; pg. 52). But Massey and Denton don’t cite how many banks used this system. As a result, it is difficult to accurately assess the magnitude to which these agencies and realtors discriminated against blacks in the U.S. Also, it is difficult to determine whether the large amounts of white-black segregation are due to discrimination by realtors or loan discrimination or a combination of both.
The strong points of Wilson’s analysis reveal that there were indeed non-racially biased forces which negatively impacted the conditions of inner city blacks including the loss of low skilled jobs, the out migration of middle class blacks from the inner cities, and the increase in young blacks in the inner cities. But Wilson’s argument lacks the racially driven factors which enhanced the decline of these conditions after the mid twentieth century and which Massey and Denton provide in their argument. These include the discrimination against blacks in the capital lending markets, white prejudice against blacks in residential areas, the susceptibility of black ghettos to economic downturn, and the development of oppositional culture in black neighborhoods. Wilson’s argument is not completely wrong but it is significantly weakened by its lack of inclusion of racially driven factors which explain the severe conditions of the black underclass. Fortunately for Massey and Denton, these scholars specialized in immigration patterns and their specialty helped them discover the racially driven trends which existed in the housing markets. Therefore, together, these books form a complete analysis as to why the conditions of the black underclass are the way they are on a national level.

This essay is written by yours truly,

Liam Sullivan

Bibliography
Wilson, William J. The Truly Disadvantaged: The Inner City, the Underclass, and Public Policy. Chicago: U of Chicago, 1987. Print.

Massey, Douglas S., and Nancy A. Denton. American Apartheid: Segregation and the Making of the Underclass. Cambridge, Mass.: Harvard UP, 1993. Print.